
Introduction
Checking read quality should be the very first step you perform. The only exception is that if you have interleaved files, you must separate them into files for forward and reverse reads first. As mentioned, it may be necessary to exclude some samples from analysis based on their having too few reads. But also, the quality reports will inform your selection of filtering and quality trimming parameters. FastQC is the program to use for checking read quality.
FastQC
FastQC scans all fastq files in a directory and produces a report in html format for each. Each report contains ten items, not all of which are relevant to amplicon sequencing. Items which are relevant are:
-
-
- Basic statistics
- Per base sequence quality
- Per base N content
- Adapter content
-
Instructions for installing and running FastQC are given here.
Interpreting Results
The following are results for one of the sequence pairs I downloaded for the Sampling Data for Workflow Development example.
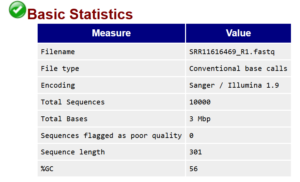
The most important elements of the basic statistics report are the number of sequences and their length. In this example I downloaded 10,000 sequences, so both values are as expected. If the number of sequences is low we would consider omitting the sample from processing.
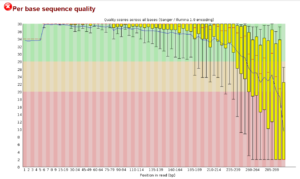
This is a plot of the quality with length for the forward read. The red line in the box and whisker plots indicates the median quality score. The boxes represent the inter-quartile range (25-75% of the reads) and the whiskers give the 10% to 90% range. As is typical, quality decreases with read length. It is desirable that there are few reads with quality scores below 20 (corresponds to 1% error rate), so this plot suggests that we truncate forward reads to a length of 260 bp or so.
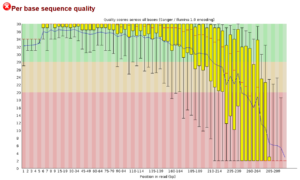
This is a plot of the quality with length for the reverse read. As seen here, read quality typically decreases with length sooner than for the forward read and requires truncation to a shorter length.
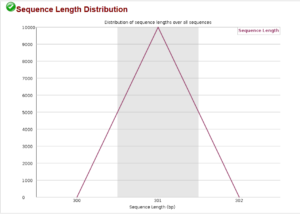
This sequence length distribution plot shows all sequences are 301 bp as expected for the sequencing machine and chemistry used. This rarely shows any difference from the expected.
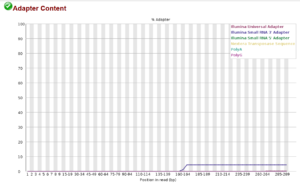
The Illumina method requires adapters be ligated to the sequences to attach them to the flow cell so that they can be sequenced. These adapters are normally removed before you receive the data. This plot shows that a very few sequences still contain the Illumina Small RNA 3′ Adapter beginning at position 160. The green check icon in the upper left indicates a pass, i.e. that the adapter concentration is too low to cause problems. Sequences with the adapter will most likely fail to merge or will be unclassifiable. If you get a caution or a warning for adapter content, you should filter the sequences using bbduk.
MultiQC
Besides the html formatted reports, FastQC also outputs compressed (zip) files containing the information displayed in the html files in text format. MultiQC scans these compressed files and summarizes the individual reports. This saves having to examine all html files.
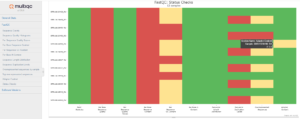
This MultiQC report indicates some per base sequence quality problems with both forward and reverse reads for all samples. Our workflow will therefore include some truncation of the reads. There is also a caution (yellow) for the forward reads for one sample, but otherwise all pass Basic Statistics, Per Base N Content and Sequence Length. The other items reported are not important to amplicon sequencing and can be ignored.
fastqcr
There is also an R package, fastqcr, for scanning and summarizing the zipped FastQC reports. See the page Scanning FastQC Results for Many Files for an example of its use.
Exercise
Run FastQC and MultiQC on the sequences you downloaded from the SRA archives. Are there any potential problems with the data?
Scan and summarize the FastQC results with fastqcr.