Compact letter displays (CLDs) are letters that show which treatment groups are not significantly different by some statistical test. It is often desirable to include CLDs on graphs. Here I show how to add them to a box plot created with ggplot2.
First, make an example plot using the iris data:
library(ggplot2)
library(car)
library(QsRutils)
data("iris")
plt1 <- ggplot(data = iris, aes(x=Species, y=Petal.Length)) + geom_boxplot()
plt1
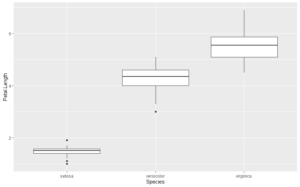
I want to add CLDs just above the tops of the box whiskers in the plot. I can use the base boxplot function to capture the coordinates for these points.
box.rslt <- with(iris, graphics::boxplot(Petal.Length ~ Species, plot = FALSE))
str(box.rslt)
List of 6
 $ stats: num [1:5, 1:3] 1.1 1.4 1.5 1.6 1.9 3.3 4 4.35 4.6 5.1 ...
 $ n    : num [1:3] 50 50 50
 $ conf : num [1:2, 1:3] 1.46 1.54 4.22 4.48 5.37 ...
 $ out  : num [1:2] 1 3
 $ group: num [1:2] 1 2
 $ names: chr [1:3] "setosa" "versicolor" "virginica"
The fifth row of box.rslt$stats gives the y coordinates for the tops of the whiskers.
box.rslt$stats
[,1] [,2] [,3]
[1,] 1.1 3.30 4.50
[2,] 1.4 4.00 5.10
[3,] 1.5 4.35 5.55
[4,] 1.6 4.60 5.90
[5,] 1.9 5.10 6.90
Next I have to get a vector of the letters to add to the plot. For this example, I will make a pairwise t-test which outputs a matrix of p-values.
ptt.rslt <- with(iris, pairwise.t.test(Petal.Length, Species, pool.sd = FALSE))
Looking at the structure of ptt.rslt, we see that ptt.rslt$p.value gives a matrix of p.values:
str(ptt.rslt)

List of 4
$ method : chr "t tests with non-pooled SD"
$ data.name : chr "Petal.Length and Species"
$ p.value : num [1:2, 1:2] 1.99e-45 2.78e-49 NA 4.90e-22
..- attr(*, "dimnames")=List of 2
.. ..$ : chr [1:2] "versicolor" "virginica"
.. ..$ : chr [1:2] "setosa" "versicolor"
$ p.adjust.method: chr "holm"
- attr(*, "class")= chr "pairwise.htest"

ptt.rslt$p.value

           setosa      versicolor
versicolor 1.986887e-45 NA
virginica 2.780888e-49 4.900288e-22
From this matrix we can use QsRutils::make_letter_assignments to get a vector of letters for our CLDs.
ltrs <- make_letter_assignments(ptt.rslt)
str(ltrs)

List of 3
 $ Letters          : Named chr [1:3] "a" "b" "c"
  ..- attr(*, "names")= chr [1:3] "setosa" "versicolor" "virginica"
 $ monospacedLetters: Named chr [1:3] "a  " " b " "  c"
  ..- attr(*, "names")= chr [1:3] "setosa" "versicolor" "virginica"
 $ LetterMatrix     : logi [1:3, 1:3] TRUE FALSE FALSE FALSE TRUE FALSE ...
  ..- attr(*, "dimnames")=List of 2
  .. ..$ : chr [1:3] "setosa" "versicolor" "virginica"
  .. ..$ : chr [1:3] "a" "b" "c"
 - attr(*, "class")= chr "multcompLetters"

ltrs$Letters
    setosa versicolor  virginica
       "a"        "b"        "c"
ltrs$Letters gives the vector of letters that we want. Now we can make a data frame to add the CLDs to the box plot.
x <- c(1:length(ltrs$Letters))
y <- box.rslt$stats[5, ]
cbd <- ltrs$Letters
ltr_df <- data.frame(x, y, cbd)
ltr_df
           x   y cbd
setosa     1 1.9   a
versicolor 2 5.1   b
virginica  3 6.9   c
If we plot the CLDs at the coordinates in ltr_df, they will over plot the tops of the whiskers . We need to nudge the CLDs upward to avoid the overlap. To determine how much to nudge, I will get the range of the Y-axis and nudge upward 5% of this range.
lmts <- get_plot_limits(plt1)
y.range <- lmts$ymax - lmts$ymin
y.nudge <- 0.05 * y.range
plt1 +
    geom_text(data = ltr_df, aes(x=x, y=y, label=cbd), nudge_y = y.nudge)
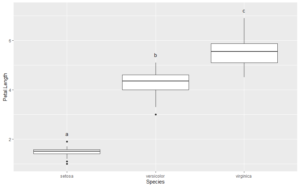
The CLDs are perfectly positioned, and without any trial and error.